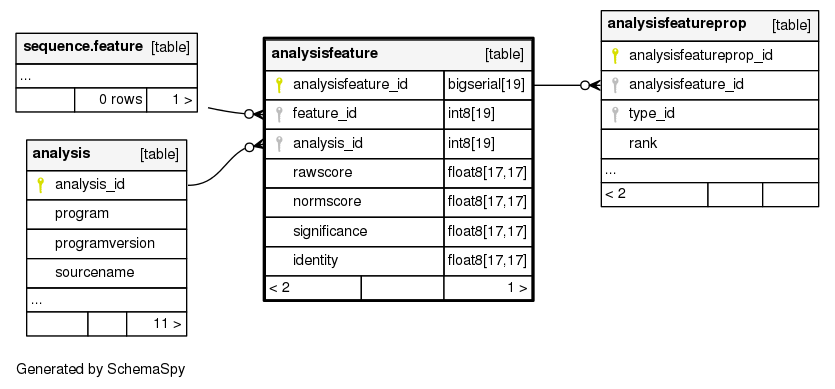
Columns
| Column | Type | Size | Foreign Key | Nullable | Default | Comments | ||
|---|---|---|---|---|---|---|---|---|
| analysisfeature_id | bigserial | 19 |
|
nextval('companalysis.analysisfeature_analysisfeature_id_seq'::regclass) | ||||
| feature_id | int8 | 19 |
|
null | ||||
| analysis_id | int8 | 19 |
|
null | ||||
| rawscore | float8 | 17,17 |
|
√ | null | This is the native score generated by the program; for example, the bitscore generated by blast, sim4 or genscan scores. One should not assume that high is necessarily better than low. |
||
| normscore | float8 | 17,17 |
|
√ | null | This is the rawscore but semi-normalized. Complete normalization to allow comparison of features generated by different programs would be nice but too difficult. Instead the normalization should strive to enforce the following semantics: * normscores are floating point numbers >= 0, * high normscores are better than low one. For most programs, it would be sufficient to make the normscore the same as this rawscore, providing these semantics are satisfied. |
||
| significance | float8 | 17,17 |
|
√ | null | This is some kind of expectation or probability metric, representing the probability that the analysis would appear randomly given the model. As such, any program or person querying this table can assume the following semantics: * 0 <= significance <= n, where n is a positive number, theoretically unbounded but unlikely to be more than 10 * low numbers are better than high numbers. |
||
| identity | float8 | 17,17 |
|
√ | null | Percent identity between the locations compared. Note that these 4 metrics do not cover the full range of scores possible; it would be undesirable to list every score possible, as this should be kept extensible. instead, for non-standard scores, use the analysisprop table. |
Table contained -1 rows
Indexes
| Constraint Name | Type | Sort | Column(s) |
|---|---|---|---|
| analysisfeature_pkey | Primary key | Asc | analysisfeature_id |
| analysisfeature_c1 | Must be unique | Asc/Asc | feature_id + analysis_id |
| analysisfeature_idx1 | Performance | Asc | feature_id |
| analysisfeature_idx2 | Performance | Asc | analysis_id |
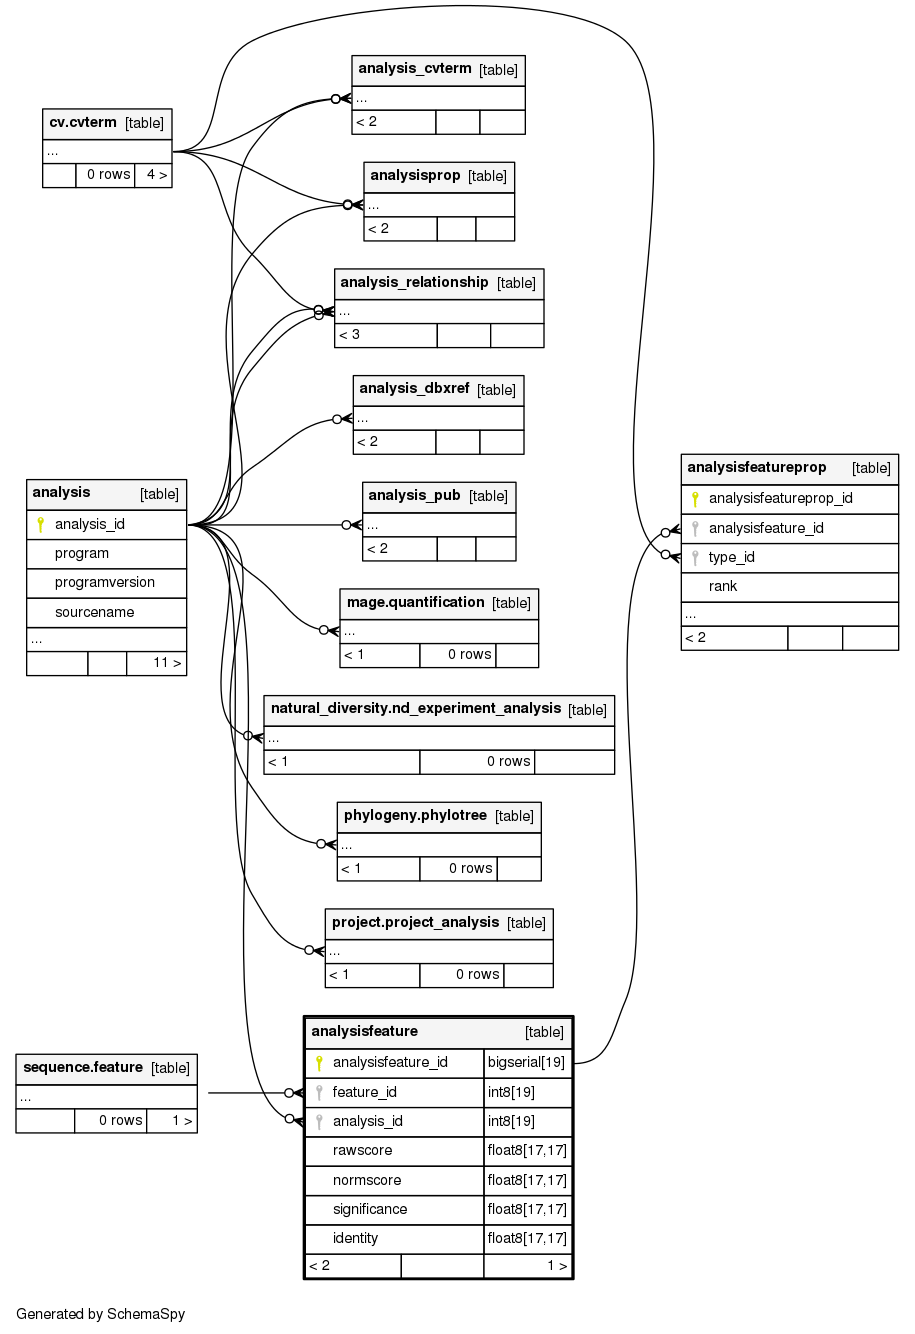
Relationships
The following entity relationship (ER) diagram shows the relationships involving the analysisfeature table.
Show relationships within degrees of separation